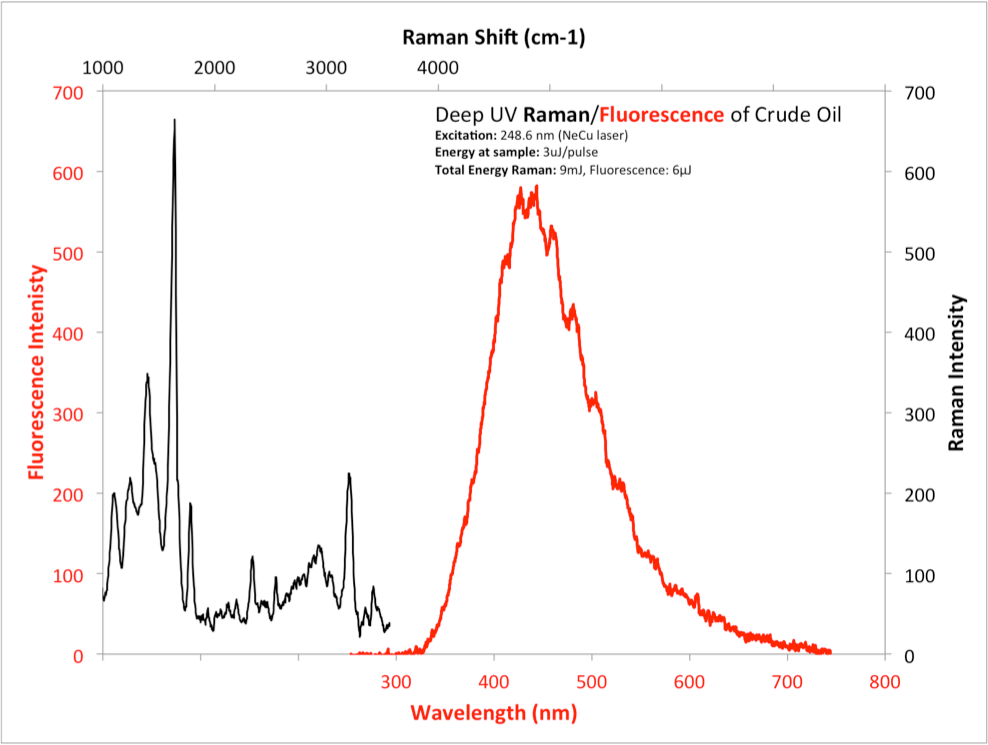
An illustration of the importance of combining or fusing Raman and fluorescence information from targets is shown below in Fig. 1. Next to Rayleigh scattering, which contains relatively little information about a target, fluorescence and phosphorescence are the most efficient emitters from most target materials, providing the ability to detect and differentiate materials at much longer standoff distances and lower concentrations than Raman emissions. However, not all materials fluoresce or phosphoresce very well. It is a common misconception that fluorescence is not a very informative method since the fluorescence from different material cannot be distinguished, however as demonstrated in 2006 - 2008, excitation in the deep UV provides a unique differentiability. Because of the efficiency of fluorescence from either target materials or their substrate or surrounding materials, weak Raman emissions are often masked unless excitation occurs below 250 nm. Separation of Raman and fluorescence emissions bands is essential even for weakly fluorescent materials or substrates. Even weakly fluorescent materials are still strong emitters compared to Raman. It is conversely true that strong water or CH Raman bands can also alter fluorescent emission spectra to lead to inaccurate conclusions unless these two spectral regions are separated. Materials that exhibit detectable Raman and fluorescence emissions include ammonium nitrates and nitrites, keytones, aldehydes, sulfuric acid, as well as explosive materials such as C4, Semtex, and ANFO's. Materials for which Raman is the only form of spectroscopic information includes water and non-aromatic amino acids, alcohols, and aliphatics. In Fig. 1, some materials, including DNA/RNA, explosive active ingredients and many chemical agents, strongly absorb both excitation and emission energy. These are among the most difficult materials to detect.

An additional advantage of using deep UV excitation is that because such a wide array of important target materials strongly absorb a these wavelengths, there is a natural spatial separation of superficial material from substrate or background material, which assists in discriminating the "topical" material from "deeper" material and provides a method of segregation of mixed materials.
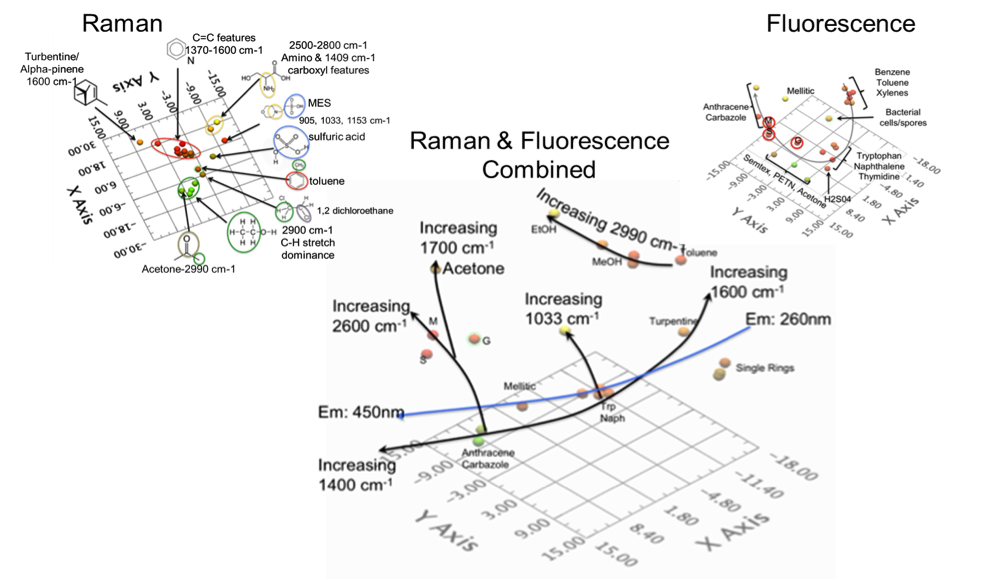
Detection of materials with any analytical method requires a database of samples against which an unknown sample can be compared. To understand the effect of a changing parameter, e.g. spectral resolution or spectral range, one needs to “visualize” changes in the relationship between samples as a parameter is varied. Multivariate analyses offer a solution by reducing the dimensionality of the input data; isolating components that provide the greatest separation. Using an approach like principal component analysis (PCA), samples that are spectrally alike, will cluster together. The ability to differentiate materials using either Raman or fluorescence alone was discussed in the 2012 paper in detail and will not be repeated here. However, the focused message is that chemometric analysis using Raman alone of 27 diverse samples shows major clustering based on ubiquitous C=C and C=H Raman bands which dominate the spectra of a wide range of organic materials and makes differentiation of these compounds difficult when using Raman alone. High spectral resolution Raman can alleviate this problem, but fluorescence spectra, even at low spectral resolution, clearly differentiates most of these organic compounds. This is illustrated in Fig. 2 below.
When chemical clustering occurs correctly, samples in one cluster should have some chemical commonality where nearby clusters should consist of samples with minor variations associated to small changes in the chemistry (i.e., the second order separation). If these changes are small, e.g., benzene versus a spore (containing dityrosine), these clusters should be closer than chemicals like benzene and anthracene (one ring versus 3 ring aromatics). In the case above, where aromaticity drives separation and a reduction in spectral range causes anthracene to closely cluster with benzene, these should never be nearby in chemometric space. In this case, the cluster containing anthracene can technically be a separate cluster.

Combining both Raman and fluorescence spectra in a common PCA analysis clearly separates different organic compounds into different groupings. In Fig. 2, the trendlines indicate how the samples are separated. The blue line is the effect of the fluorescence information and sets the “backbone” of the chemometric space. The 1400 to 1600 cm-1 Raman trendline closely follows this but causes some of the aromatic samples like turpentine to migrate away from the fluorescence trendline. The combination of low wavelength fluorescence and strong C-H stretching mode uniquely place toluene in the chemometric space. Xylenes however did not exhibit this C-H feature in its Raman spectrum. Therefore it clusters in the single ring group.

Get In Touch
Keep informed about the latest deep UV developments at Photon Systems by joining our mailing list.
ADDRESS
1512 Industrial Park St. Covina, CA 91722-3417
PHONE
626 967-6431
